
Reefer Market: May/June 2021
Seafield Reefer Index
SHIPFLATION!
Summary:
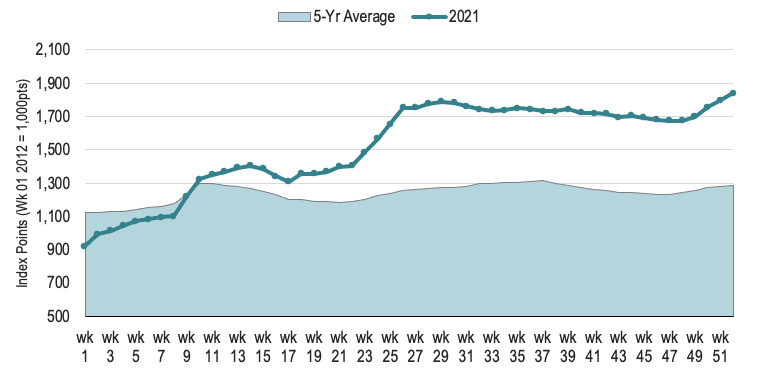
- Shipowners in the conventional Reefer market had an exceptionally good year last year. This upturn in fortunes is reflected in our in-house ISB Seafield Reefer Index* which closed 2021 on a six and a half year high of 1,841 points, an increase of 104.9% year-on year. The index averaged 1,517 points/week during the year, up 43.6% from the previous years’ weekly average.
- The index mirrors the rise in both spot and period reefer freight rates that we have observed across all of the primary reefer market segments including the sub segments which we are also specialising.
- Notably from our own primary markets we have observed the following rate changes for reefer cargo on the following trade routes:
- Pacific to Atlantic (West Africa) (400-550k,cbft) 103% +
- North Europe to South Atlantic Africa (400-550k cbft) 101% +
- North Atlantic – West Africa (200-400kcbft) 63.5% +
- Intra- West Africa (200-400k) 76.5% +
- N.Atlantic – Baltic (200-300k) 97.0% +
- The continued intensification in demand for conventional reefer capacity was driven by the ongoing problems in the global container shortages which in turn has been compounded by major disruptions to supply chains caused by the global pandemic. According to recently published data global supply-chain disruption in the container markets saw container shipment rates soar by an average of 200% over the 2021. The surge in demand contributed to widespread displacement of empty reefer containers from key loading ports. Faced with rising costs and lack of equipment, many reefer cargo shippers turned to conventional reefer vessels to fill the gap.
- According to the United Nations (UNCTAD), Shipping freight costs have contributed 1.5% towards global inflation over the past 12 months. Shipping has become a major push factor now in driving inflation due to the shift change from a reasonably low and steady cost to an unprecedented explosion of freight charges.
- In the smaller handysize reefer segment (100k-350k cb.ft. vessels), time charter equivalent returns for Owners averaged $1.00/cb.ft/month, a 62.8% year-on-year increase as enquiries from meat exporters in South America, amongst other non-core trades, took-up the slack from what was a quieter frozen fish market out of the key Moroccan/Mauritanian fishing grounds (22% volume contraction year-on-year).
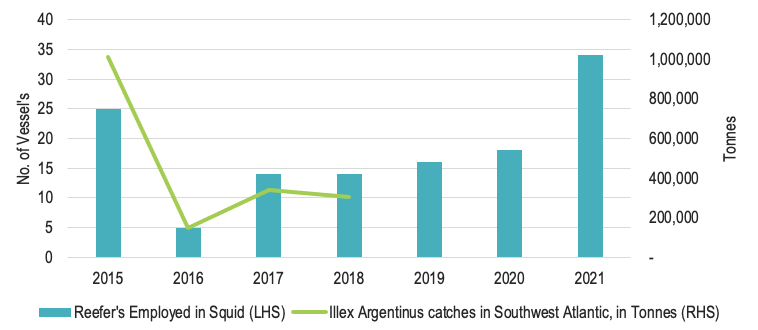
- In the larger reefer segment, the market was also characterized by a lack of reefer container capacity in South & Central America, South Africa, New Zealand. Squid catches in the South-West Atlantic, often the bellwether for the larger reefer vessels market’s direction during the first quarter, – recorded a substantial improvement, with our records indicating a 90% increase in reefer capacity deployed in the trade during the 2021 season, setting a firm platform for upside in freight levels during the remainder of the year.
- The larger reefer vessels are mainly trading in fruit / banana trades and as such the primary operators in these markets a sizeable increase in demand for reefers in the larger reefer segment (350k+ cb.ft. vessels), where TCE returns averaged almost USD 0.90 during the year, a remarkable 109.7% increase year-on-year. This conversely has impacted the costs for the primary fruit / banana traders and producers
- The sharp rises in dry container freight levels and shortage of equipment also pushed some of this volume towards using breakbulk vessels. 5k-15k dwt , which drove up freight rates in these segments. Reefer vessels, due to their multideck, multipurpose configuration meant that they were also perfect substitutes for this cargo.
- Despite booming freight levels, the conventional reefer fleet continued its contraction in 2021, with a net loss of 2.95 mn cb.ft. capacity (down minus 1.6%) as rising demolition prices saw many owners of 1970’s & 1980’s-built handysize tonnage cash-in.
- Fleet capacity (for vessels > 100,000 cb.ft.) stood at 185.75mn cb.ft. (576 vessels) by the year’s end, with an average age of 28.5 years.
- Our outlook for 2022 is that the fleet utilisation will remain at close to 100% this year as increased demand due to lack of reefer container capacity will continue, coupled with longer voyages and increased tonne miles per vessels.
Market Overview: 2021
Conventional reefer tonnage continued to reap the benefits of container shortages and displacements throughout the year as enquiries from staple trades and new shippers alike combined to consistently outstrip the available supply of tonnage. Our in-house ISB Seafield Reefer Index as a result doubled across the year, closing at a six-and-a-half year heigh of 1,841 points, as spot rates on many routes hit record highs.
Figure 1: ISB Seafield Reefer Index 2021
Often the bellwether for the market’s direction, squid catches in the South-West Atlantic continued to display signs of biomass regeneration with volumes once again improved year-on-year, tracking upwards towards the next projected peak season in 2023 (see Figure 2). We recorded an approximate 90% increase in reefer capacity deployed in the trades during 2021, and with this capacity tied-up for upwards of three months, the ensuing supply-pinch helped lift freight levels market-wide causing TC returns to more-than double in the space of a couple of months to above USD 1.00/cb.ft., the first time in six years for larger 450,000+ cb.ft. vessels.
Figure 2: Reefer deployment to South-West Atlantic Squid**
Upheaval in the container markets meanwhile was at the core of improving fortunes for conventional tonnage throughout the Covid-19 pandemic. Bottle-necked ports and displaced reefer and dry boxes – a consequence of localised lockdowns and persisting virus outbreaks at ports – forced the hand of many reefer cargo shippers frequently left high-and-dry by containership operators unable to supply either the empty boxes, or vessel capacity to meet their needs.
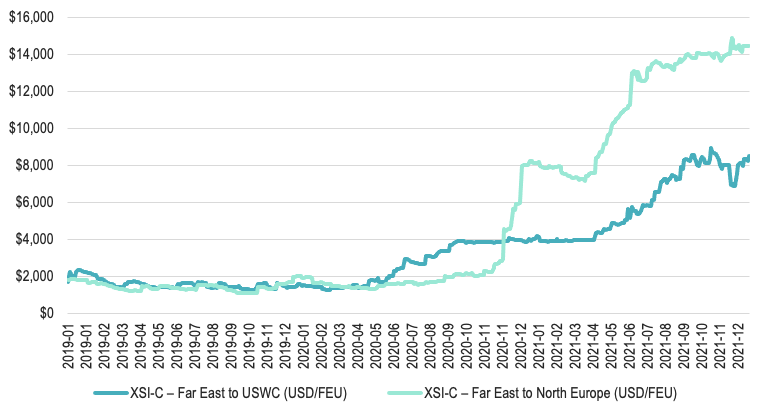
A key driver of this disruption was surging inventory re-stocking in OECD countries during the second-quarter onwards, as global pandemic restrictions began to ease and pent-up demand for consumer goods was released, prompting a spike in dry box rates out of the Far East, rising 75-85% on the mainlanes East & West through the remainder of the year (see Figure 3). Unable to compete with the higher paying dry box rates, many reefer cargo exporters were unable to secure slots, or indeed empties which were being shipped ‘dry’ at higher rates. Those with the scale to shift into larger bulk shipments turned their attention to conventional reefers, with the expanding modal shift prompting a sustained lift in demand and freight levels market-wide through the remainder of 2021.
Figure 3: Xeneta Shipping Index by Compass – Container Freight Rates from the Far East (Jan-’19-Dec’21) in USD/FEU
In the handysize reefer segment, characterised by a fluid spot market, the firm platform established by the buoyant squid trades combined with a steady increase in demand for capacity from non-core trades as the year progressed to keep the fleet close to fully employed, and TC-equivalent returns for owners up more than 150% over the twelve-month period.
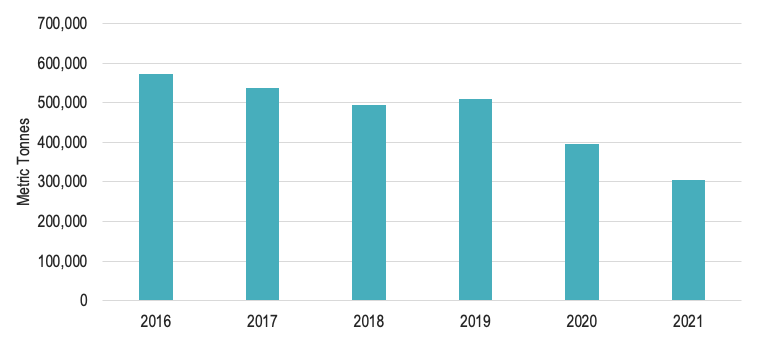
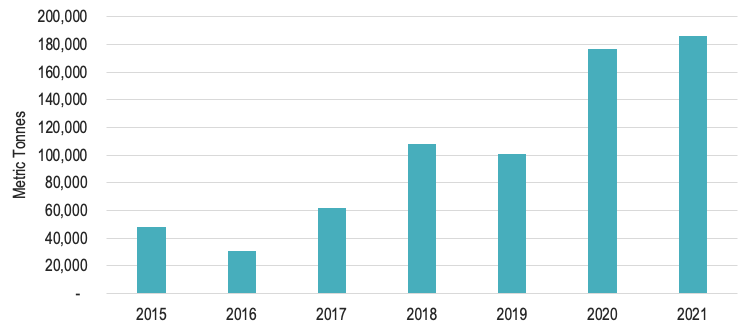
The rise in freight levels has been remarkable when considered against the backdrop of a subdued West African frozen fish trade from Mauritania/Morocco – traditionally the segments most fluid spot market and freight-setter. Despite benchmark freight levels on the trade into Nigeria reaching their highest level since 2015, we recorded a sizeable drop in shipped volume across 2021 which totalled approximately 300-320,000 nmt, down abt. 22% year-on-year, and historically low in comparison with prior years which exceeded 500,000 nmt shipped.
Figure 4: Cargo loaded ex Mauritania/Morocco (mt)
Indeed, it was the case of a ‘rising tide lifting all boats’ in Morocco/Mauritania. Strong Blue Whiting and Mackerel seasons in the Faroes were a key driver for the smaller segment as shipments into West Africa exceeded 180k net mt for the year (up 5% on what was already a strong year in 2020) with rates up by 76% for the year compared to fixing levels of 2020. Meanwhile steadily increasing enquiries from wider afield saw a flurry of meat shipments from Brazil, and even fish cargoes from Argentina, as supply-chain disruptions worsened and shippers sought out conventional tonnage, all of which combined to keep the handysize fleet fully employed with short – if any – idle periods between charters.
Figure 5: Cargo Loaded ex Faroes for WAF (mt)
In the larger 400,000+ cb.ft. segment, reefer exporters in Southern Africa, South & Central America and New Zealand faced widespread capacity shortages from the outset, with the global south especially effected by the imbalance in box re-positioning. Although much of the conventional reefer capacity for the fruit business was secured under COAs for the year, prevalent especially in the banana trades, surplus volumes continued to draw heavily on the larger reefer tonnage in the absence of container capacity. Meanwhile, frozen fish shipments from the Far East into West Africa were steadily switching mode, giving much of the squid fleet a return cargo into the Atlantic and keeping spot lists trim.
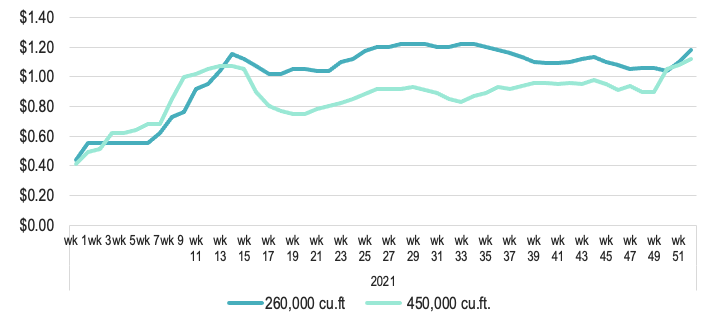
Indeed, securing backhaul cargoes to maximise returns also proved highly profitable for operators, with higher paying dry cargoes even usurping reefer volumes on occasion, placing greater supply-pressure on shippers. As the year drew to a close and COA/TC renewals were up for renegotiation, owners and operators in the larger segment became more ebullient as they sought to recover lost gains and bid freight-levels higher. Far East to West Africa, and North Continent to West/Southern Africa rates were up more than 100% across the year, while overall TCE returns tripled to USD 1.12/cb.ft by the close of 2021.
Figure 6: TCE returns across 2021
For many Reefer operators’ it has therefore been year to ‘make hey while the sun shines’, even moreso as the sun continues to gradually set on the technical life of many vessels in the steadily ageing reefer fleet. Despite the hot freight market, many owners succumbed to rising scrap prices, up almost 50% to just below USD 600/ldt across the year, with approximately 7.5mn cb.ft. of capacity lost to the fleet through demolitions of primarily 1970’s & 80’s-built Far East-operated handysize tonnage, in addition to a couple of conversions.
Figure 7: Fleet contraction (2015-2021)
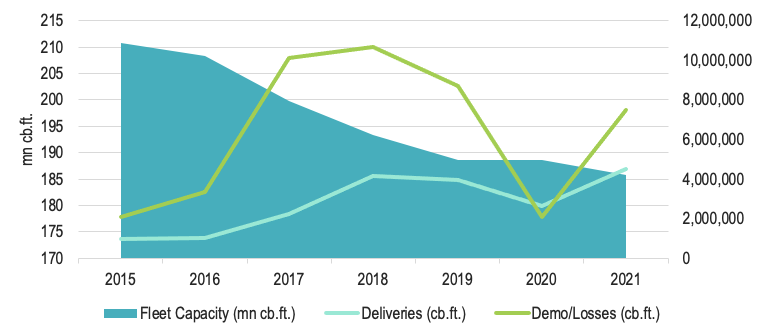
Deliveries of newbuild reefers, predominantly in the 400,000+ cb.ft. segment added 4.5mn cb.ft. to the fleet. By the close of 2021, the 100,000+ cb.ft. fleet stood at 576 vessels (down 21), of a combined 185.8mn cb.ft. capacity (down 1.6% year-on-year), at an average age of 28.5 years.
There is little sign that freight levels will drop-back through 2022, with the near -to-medium term outlook suggesting capacity shortfalls are far from being solved. Already through January, rates have further spiked as tonnage becomes stretched ahead of this year’s squid and Chilean fruit seasons, with handysize levels set to reach record highs during February. Our outlook for 2022 is that the fleet utilisation will remain at close to 100% as increased demand due to lack of reefer container capacity will continue, coupled with longer voyages and increased tonne miles per vessels. Freight rates are likely to continue to remain extremely firm for the remainder of the year.
About Seafield
Seafield Shipbrokers are one of the leading independent Chartered Shipbrokers working in the global reefer markets. We are primarily acting on behalf of global commodity trading groups and primary producers. Our team has an average of 25 years experience in reefer markets with a variety of backgrounds of shipbroking, analytical, operations, seagoing and vessel shipownership.
* The ISB Seafield Reefer Index has been published in-house by Seafield Reefers since August 2014 and is the only index worldwide covering the conventional Reefer market.
Modelled on other successful indices that represent the chartering markets for other ship types such as Bulkcarriers, Tankers and Containerships, the ISB Seafield Reefer Index is computed from the input of brokers, ship owners/operators and market sources, which combined have wide market coverage.
Determined weekly (Friday), the index is a weighted assessment of four key indicators: the spot freight rate ($ per MT) for a 3,500 mt cargo of frozen fish from Morocco/Mauritania to Nigeria; the spot freight rate ($ per box) for a banana cargo from Ecuador/Colombia to Baltic-Mediterranean; the TCE earnings ($ per cb.ft.) for a 270,000 cb.ft. reefer; and the TCE earnings ($ per cb.ft.) for a 450,000 cu.ft. reefer. The base period for the index is Week 01, 2012 at which point it has been set to 1,000 points.This methodology enables coverage of both the frozen and fruit trades: frozen via its primary spot market in the West African pelagic trade as well as coverage of meat, squid, tuna and other frozen cargoes through TCE earnings for handysize reefers; and fresh trades via spot rates for the main banana trade as well as other fruit including citrus, deciduous and kiwis incorporated into the TCE earnings for panamax reefers.
Since its inception in 2014, the index has become a recognised indicator for measuring developments in the conventional reefer market and has been frequently referenced by industry press to assess current trends in rates, highlight past cycles in the market, and provide a snapshot of the sectors current health.
*Disclaimer: The ISB Seafield Reefer Index may be published, only with source reference ‘ISB Seafield’. It is distributed for information purposes only and cannot be relied upon as a trading recommendation. The reported information is obtained from market sources. While every effort has been made to ensure the accuracy and the completeness of the Index, ISB Seafield makes no representations, conditions or warranties of any kind, express or implied, about the completeness, accuracy, reliability, or suitability of the ISB Seafield Reefer Index. Any reliance you place on the Index is therefore strictly at your own risk. Neither ISB Seafield nor any of its subsidiaries or affiliates nor any employee of the foregoing shall be liable or have any responsibility for any loss, liability or damage, cost or expense including without limitation, indirect or consequential loss or damage, or any loss or damage whatsoever arising from loss of data or profits arising out of, or in connection with, the use of and the reliance on the Index.
**Excludes Chinese/Korean/Taiwanese-owned vessels.