
Reefer S&P Market
Jump to Section:
Welcome to our latest S&P Market review and list of secondhand Reefers which we can develop for sale. Transactions so far this year are lower than the 20 vessels which changed hands in 2016, however this is in part due to a recent upturn in scrap prices, which has increased the competitiveness of yards in the sub-continent when bidding for older tonnage.
It remains clear that an ageing fleet can only continue to support the current demand for a few more years before the shortage of Reefer tonnage is likely to become much more critical, leaving those companies dependent on this type of vessel particularly exposed. We forecast that between 50-70 more reefers will be scrapped over the next 3-4 years with replacement ratio of newbuildings , this is likely to include a higher percentage of vessels currently servicing the Atlantic fishing sector both North and South. This will no doubt have serious impacts on the supply chains for companies engaged in fishing unless more proactive and sustainable approach is taken by the companies in the frozen sector. We are however seeing some positive signs with currently 12 new reefer ships on order in the 180-300,000cbft size that will be delivered during the next 18 months largely driven by companies engaged in the fishing segments.
We are currently working with several yards in Asia that are engaged in the design and building of reefer vessels with new buildings scheduled for our clients in early 2018. We will be happy to provide you with more details of various new building plans and financing options that are available.
Current S&P Candidates: For full listing, please click <here> (for password access, contact brokers@irishshipbrokers.ie)
Transactions, 2016 & 2017
Table 1: Secondhand Sales 2016 & 2017
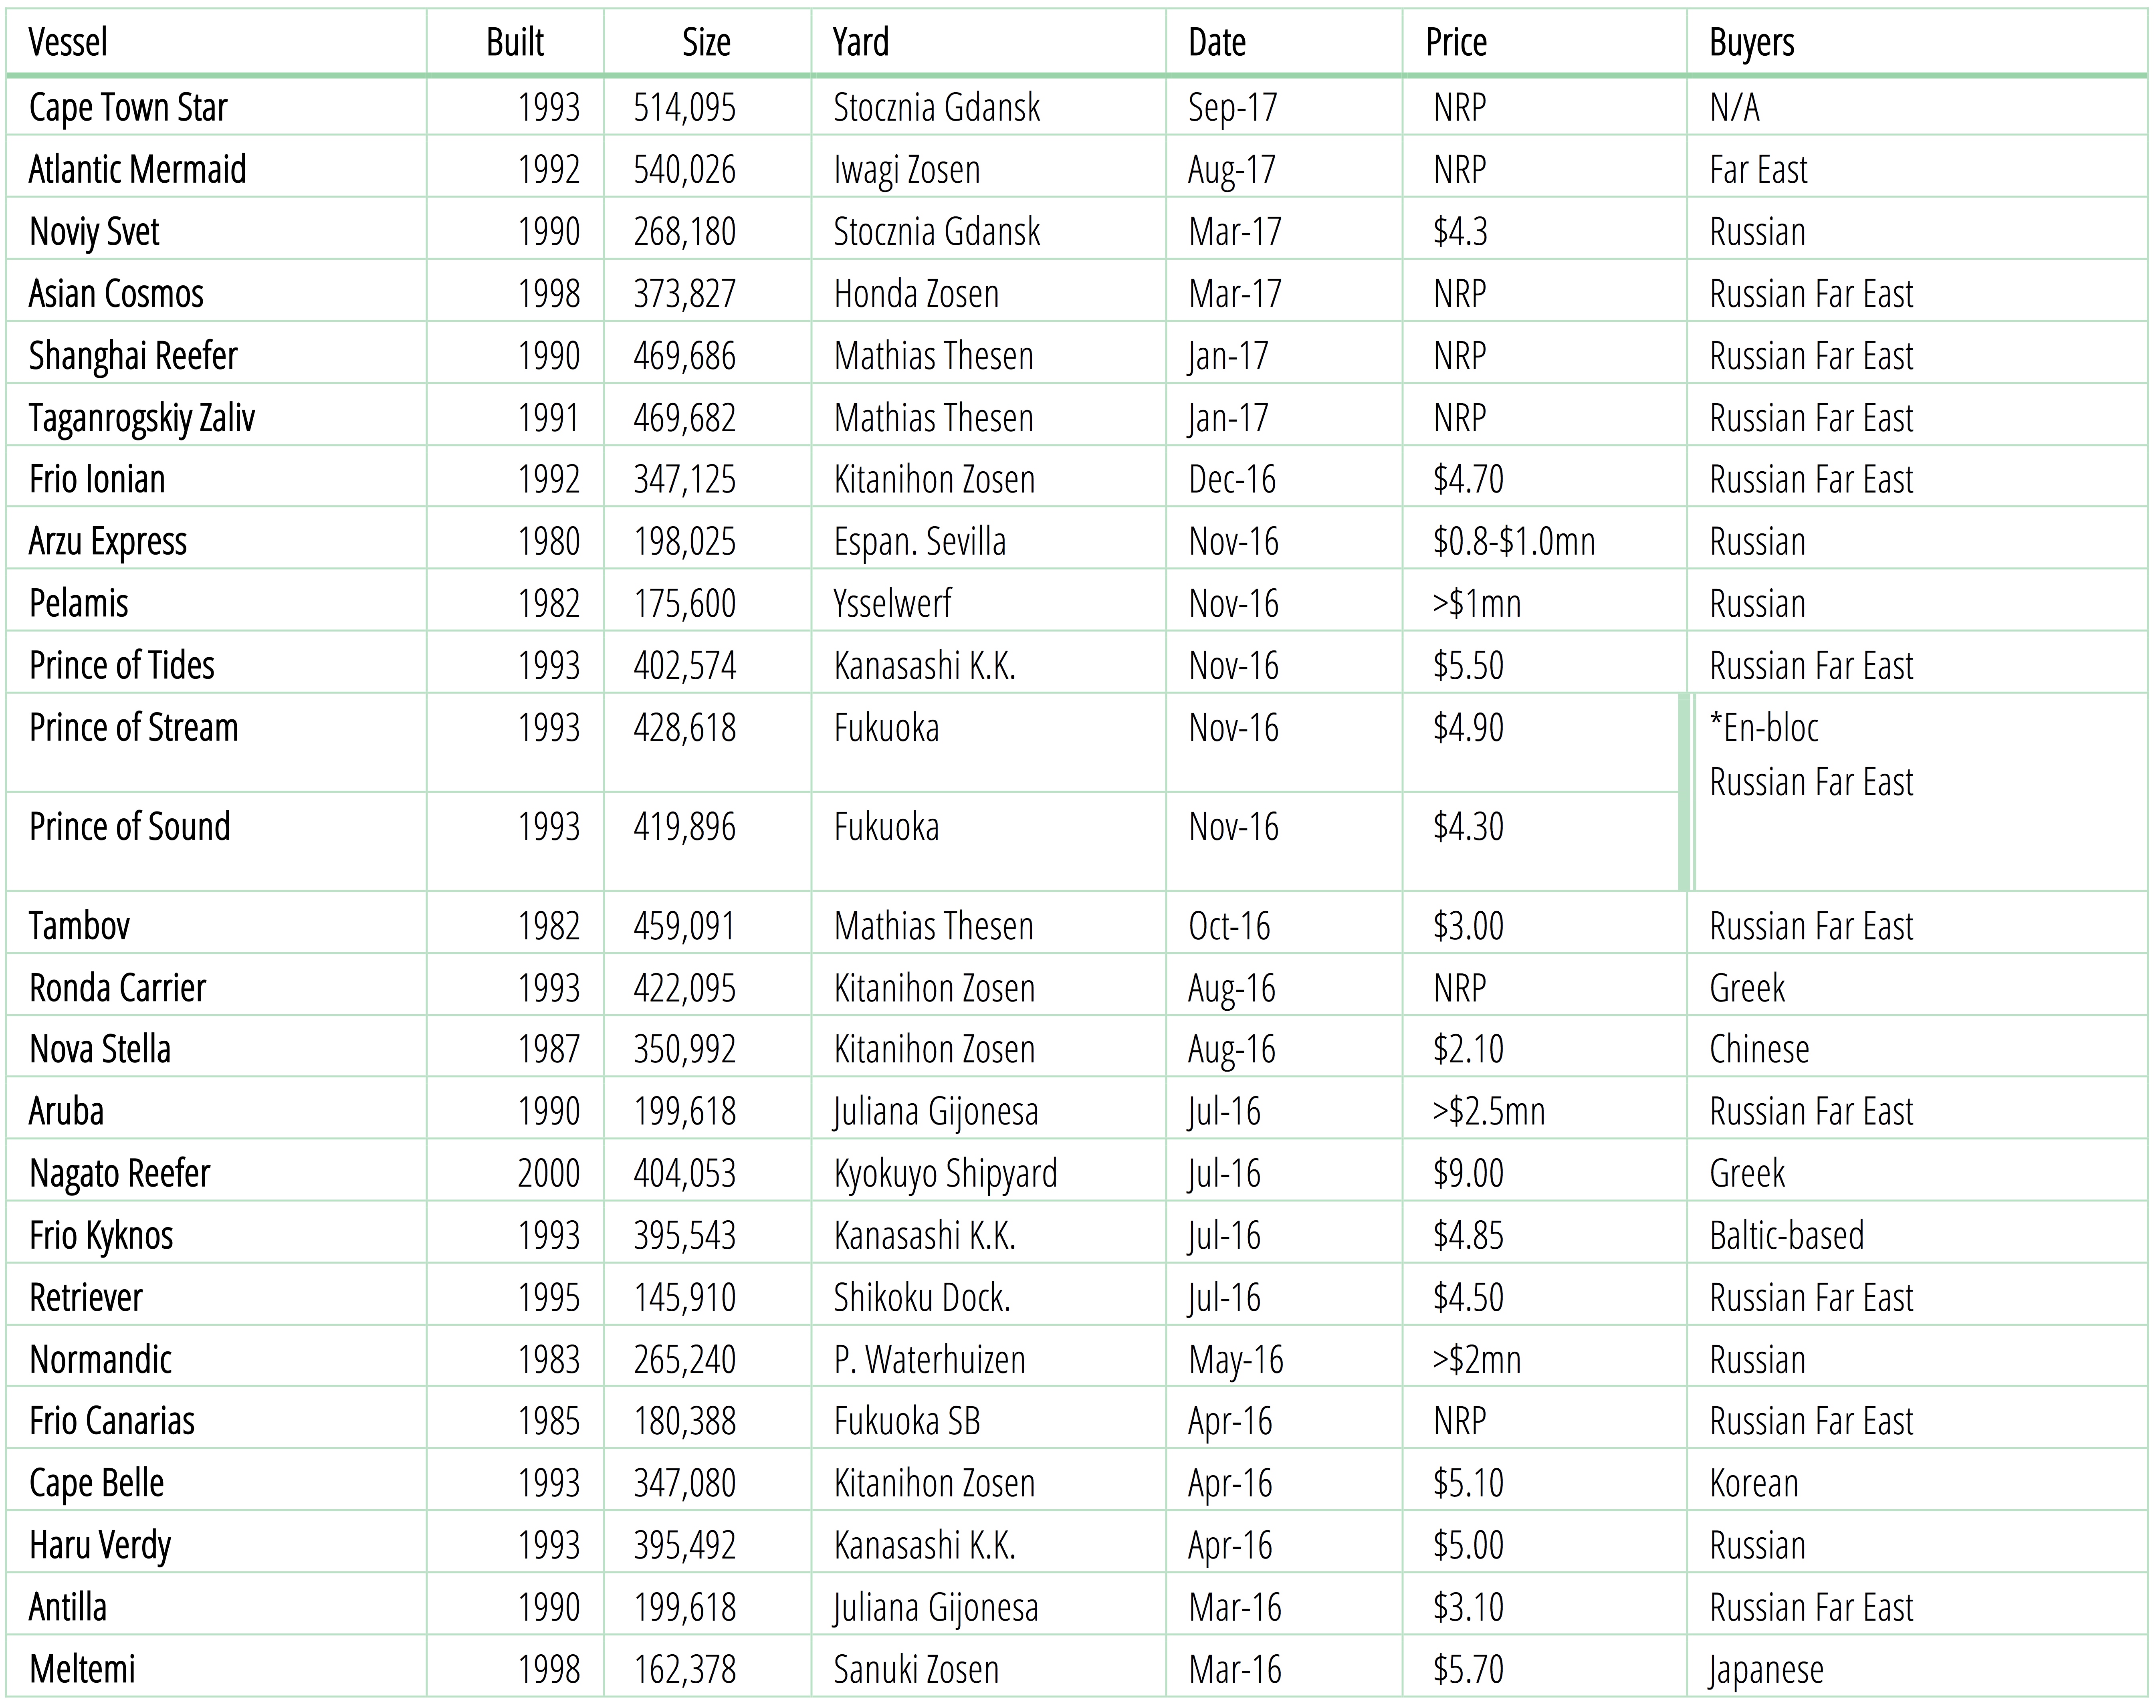
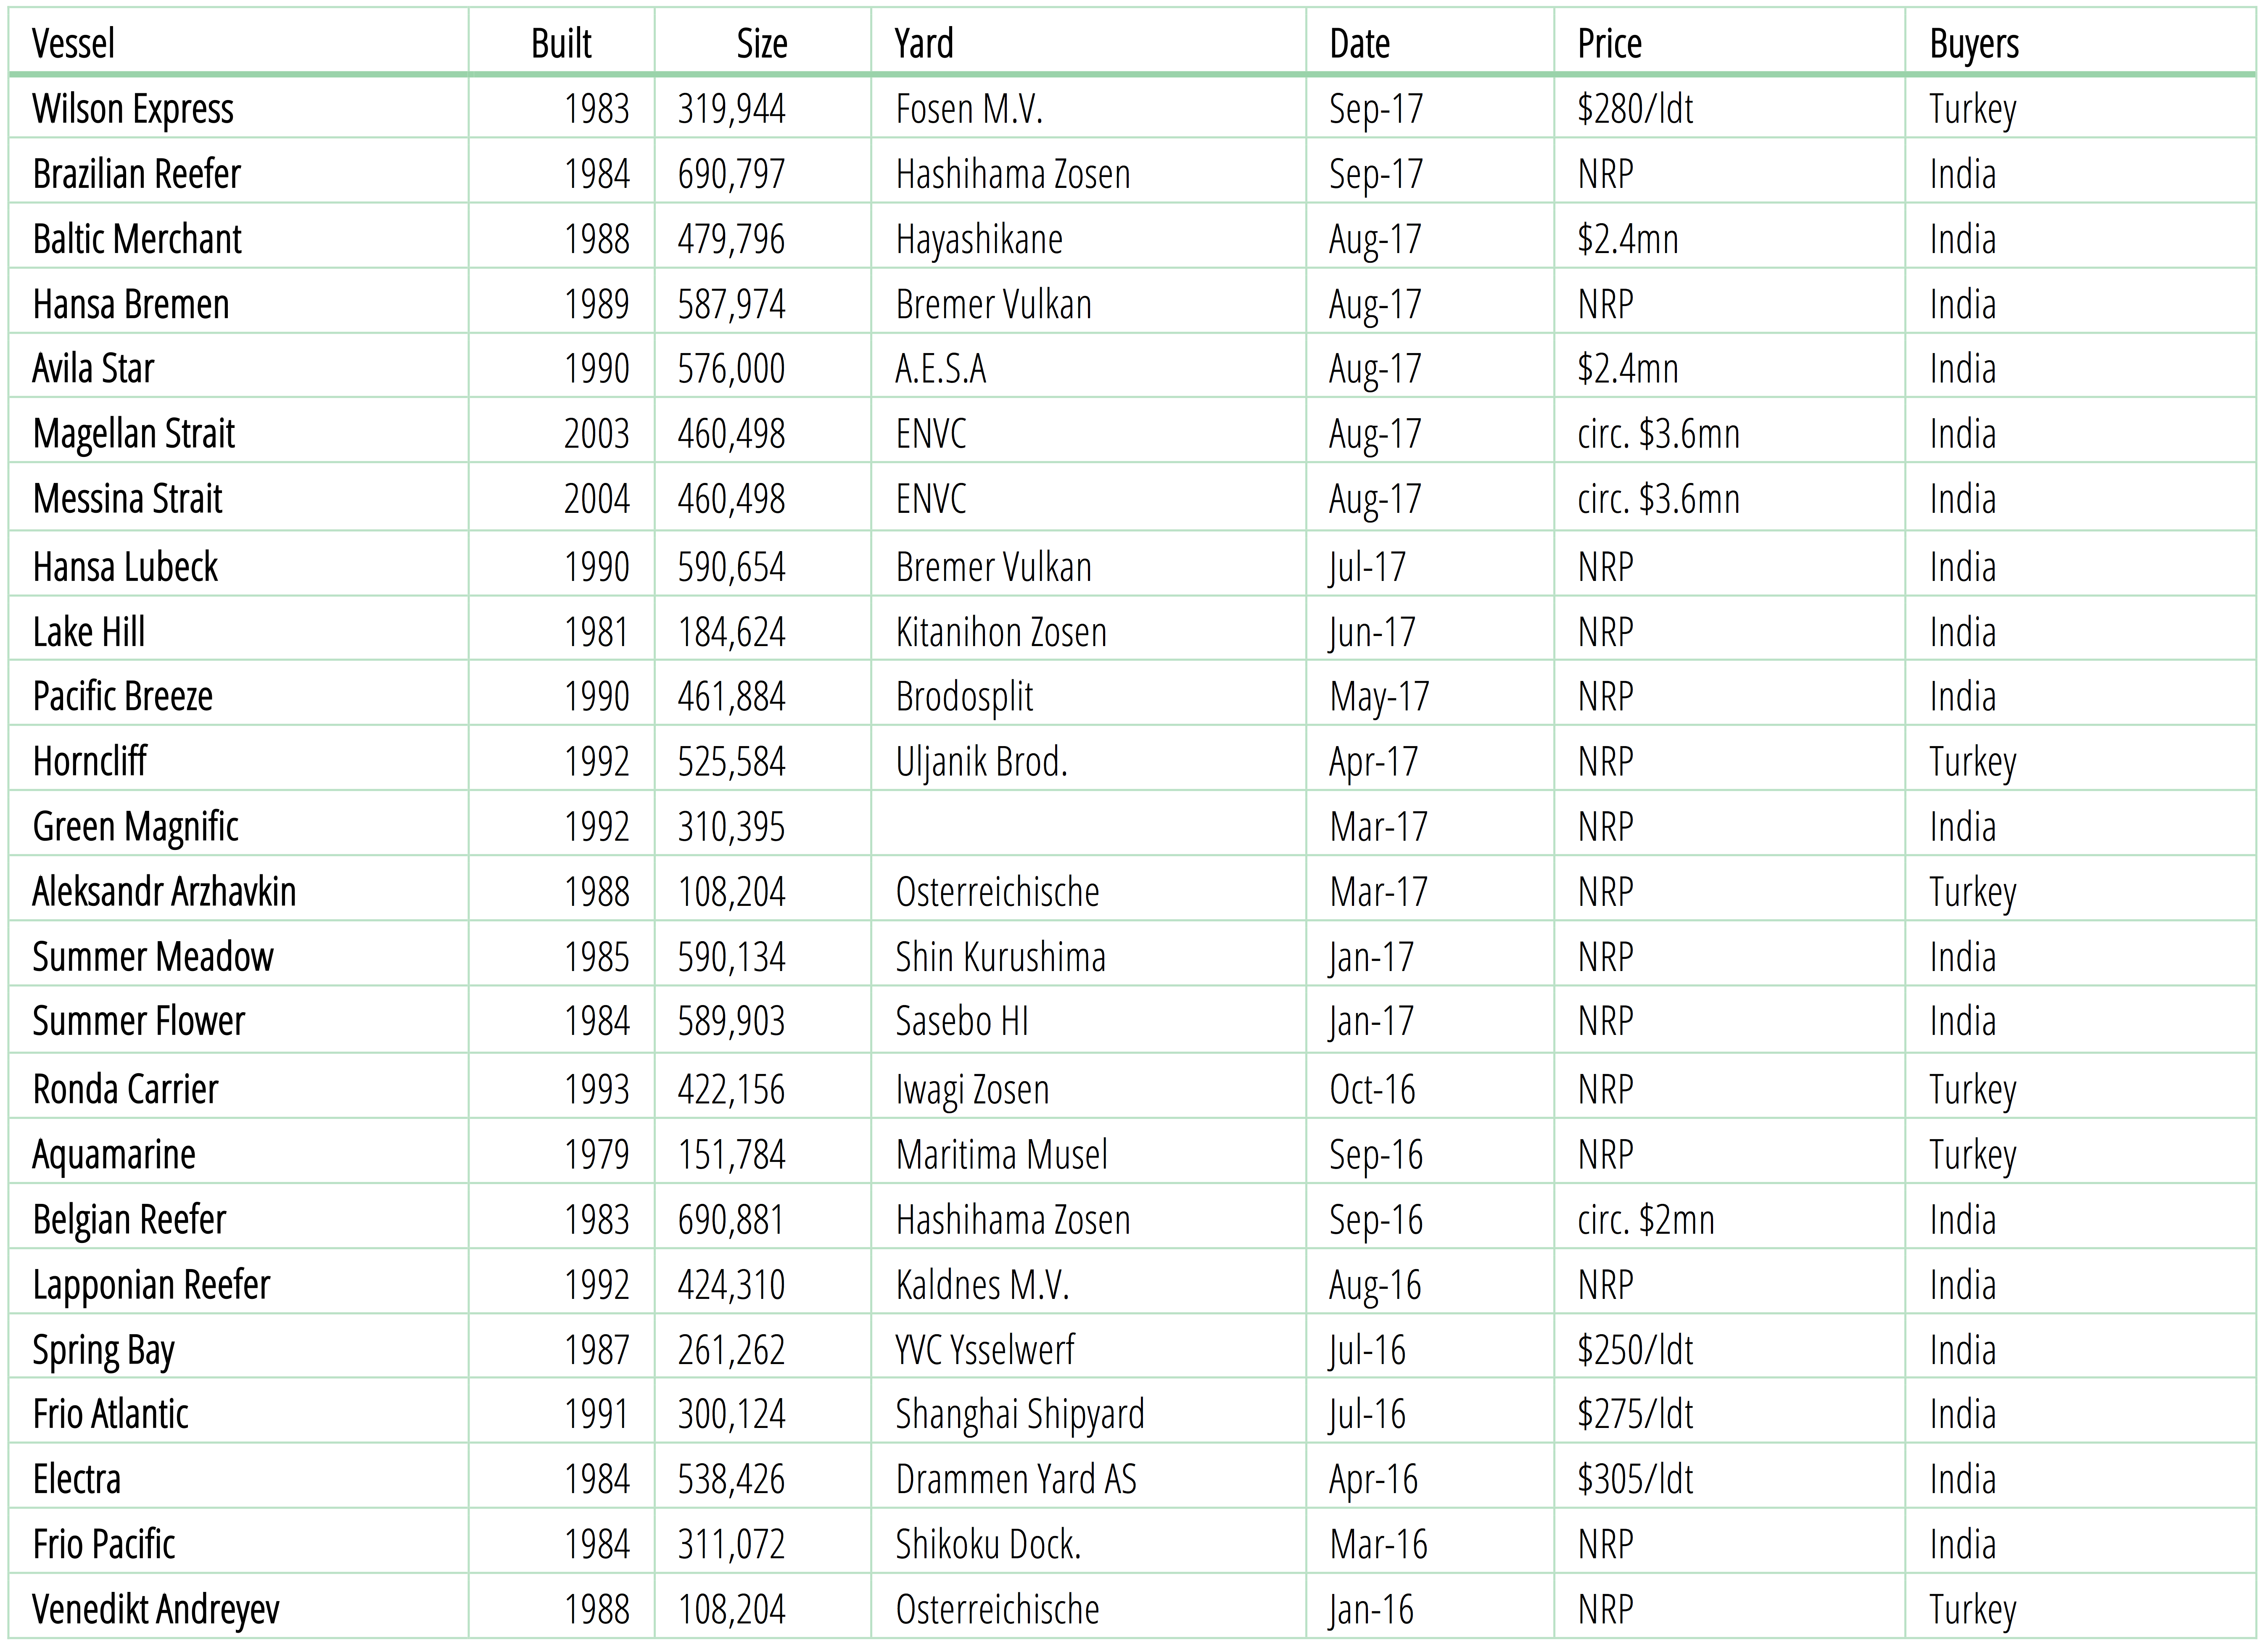
Table 2: Demolitions 2016 & 2017
Fleet Overview
Our latest Analysis (September 2017), shows the reefer fleet currently stands at 634 vessels larger than 100,000cu.ft. (including freezer tonnage) totaling 202.7 million cubic feet in capacity, with an average age of 26 years and 11 months. The key segment for the frozen fish industry, the 100-299,000cu.ft. segment, accounts for 34% of the market by capacity in total cubic feet, or 58% by number of vessels. The 300-399,000cu.ft. segment – also popular for carriage of frozen fish – accounts for 9% of the market in capacity terms. Accounting for the ongoing minimal deliveries of newbuild tonnage over the last 18 months as well as the recent acceleration in demolitions of older vessels, the overall fleet has reduced in size by 16 vessels (-3.6%) since January 2016.
Over the last 10 years, the reefer fleet has contracted by more than one-third from 309 million cubic feet total in 2008 to 202 million cubic feet at the beginning of September 2017 (See Figure 1 below). The bulk of this contraction occurred between 2008-2012, following which the improving freight markets combined with lower bunker prices allowed Owners to continue running older vessels at a profit well into 2015. However, tougher market conditions since late-2015 saw the fleet’s rate of contraction increase once more, while the rise in scrap rates in the sub-continent during June-September of 2017 has sparked a flurry of interest from reefer owners to scrap older and now uneconomical tonnage. This has been particularly evident amongst the large and jumbo segments (> 400k cu.ft.; See Figure 4 below), which traditionally service the fruit trades and have faced increasing competition from container lines. The reported sale of the Baltic Merchant (480k cu.ft.) for $405/ldt contrasts dramatically with sales earlier in the year at sub$380/ldt levels, and with further demolitions of large and jumbo vessels highly likely before the year-end, we are forecasting a -4.2% decrease in the reefer fleet across 2017, the largest annual contraction in five years.
Divergence between small-midsize and large-jumbo segments:
A continuing modal shift to containers for several of the key trades traditionally serviced by the large and jumbo reefer segments (Kiwis, Bananas, Citrus …) has resulted in Owners shifting their newbuild strategies away from conventional reefer tonnage towards fully containerised reefer vessels in an attempt to compete with the container lines. With this trend set to continue, large and jumbo reefer tonnage will remain in a slow and gradual decline.
Small to Mid-sized reefer vessels – vital for servicing the frozen fish trades – are less prone to competition from the container lines due to the need for high seas transhipment, however they face their own challenges. An ongoing concern for us as brokers is that contracting for newbuild tonnage in the 100-300k cu.ft. segment remains moderate (12 vessels are currently on order), while the average vessel age is almost 30 years now (see Figure 6 below). Despite the ageing fleet and recent increase in scrap prices, there have been few demolitions of small reefers in 2017, while interest on the secondhand market for further trading is heating up. This suggest that capacity in the small to mid-sized fleet is being stretched to its limits, evidenced by the recent spikes in the spot market over the last four-months. The trading life of a number of older small to mid-sized reefer units is being extended to meet current demand levels, with reports of SS-renewals for tonnage > 30yrs old; however, demolitions in the next few years are expected and newbuild tonnage will be required to fill the void.
Table 3: Fleet Statistics, Sept. 2017
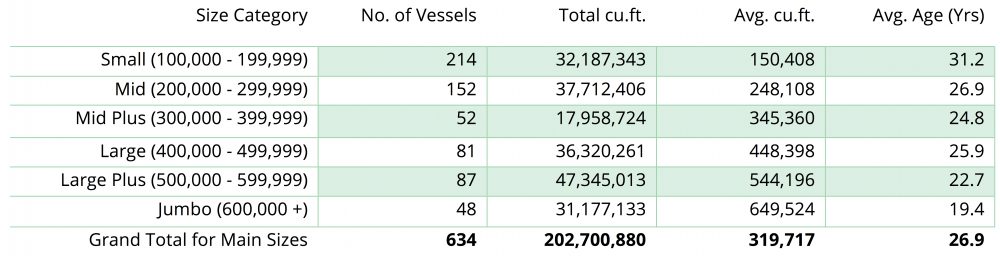
Source: ISB-Seafield / Clarksons
Figure 1: Decline in Reefer Fleet Capacity, by total cubic feet (>100k cu.ft., 1997-present)
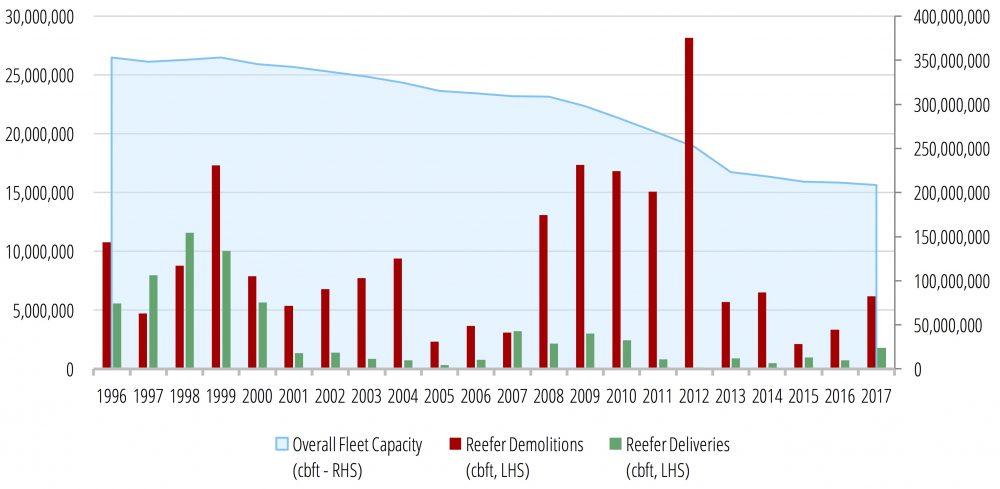
Source: ISB-Seafield / Clarksons
Figure 2: Annual % Change in Reefer Fleet Capacity (>100k cu.ft., 1997-present)
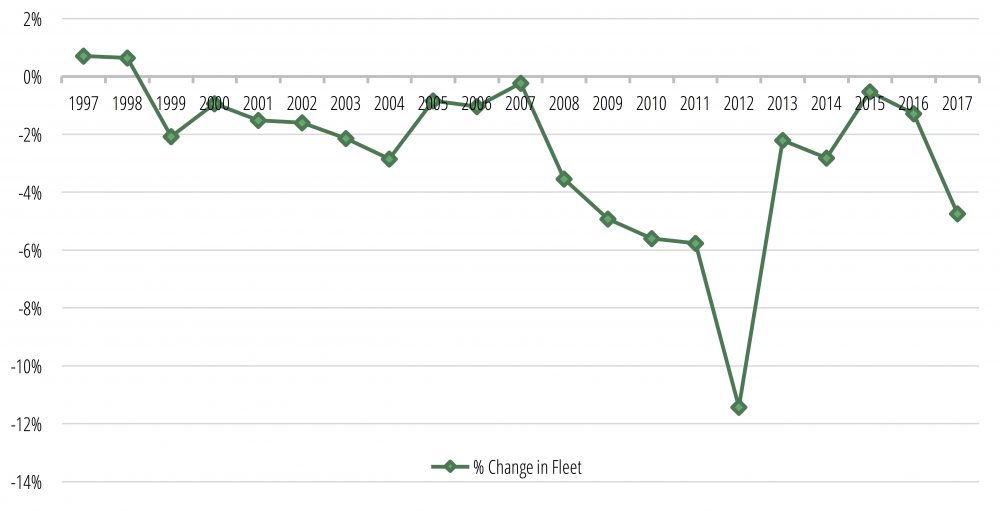
Figure 3: Reefer deliveries, by total cubic feet (>100k cu.ft., 1997-present)
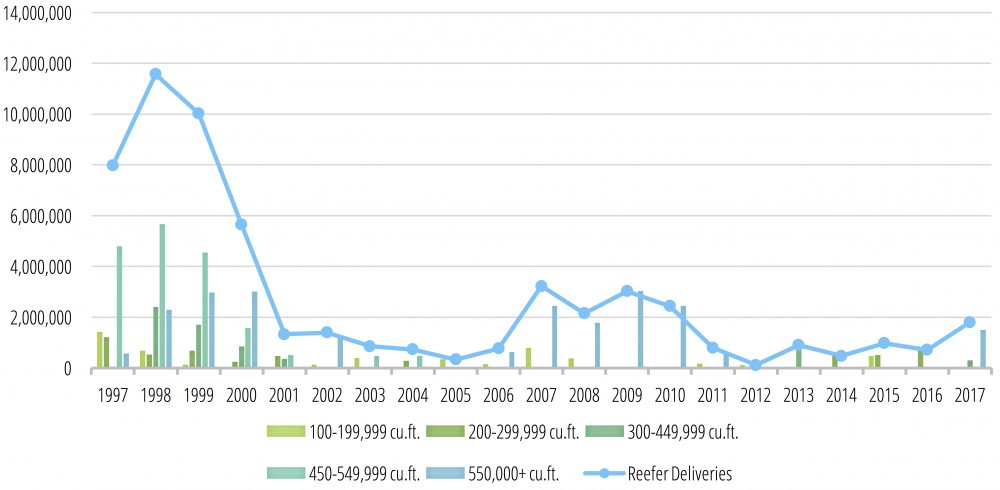
Source: ISB-Seafield / Clarksons
Figure 4: Reefer demolitions, by total cubic feet (>100k cu.ft., 1997-present)
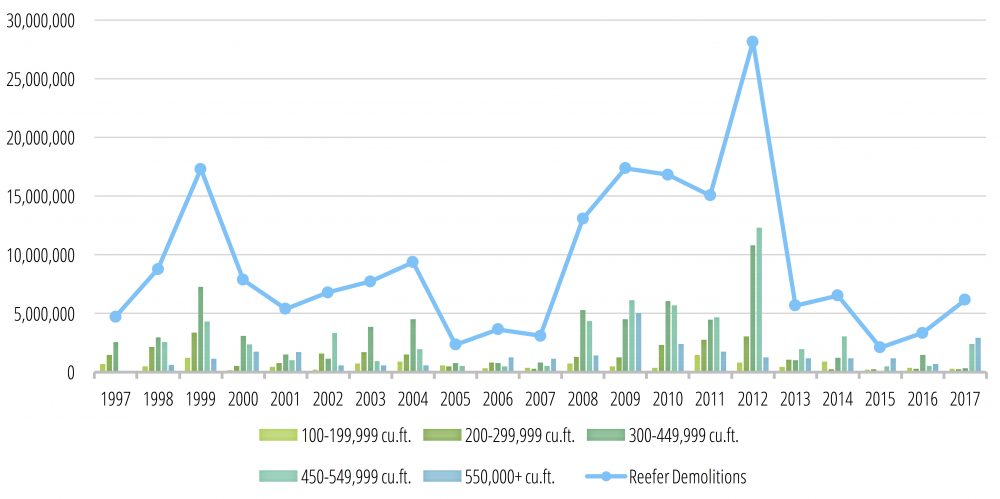
Source: ISB-Seafield / Clarksons
Figure 5: Demolition Prices in India (Sept. 2012 – Sept. 2017)
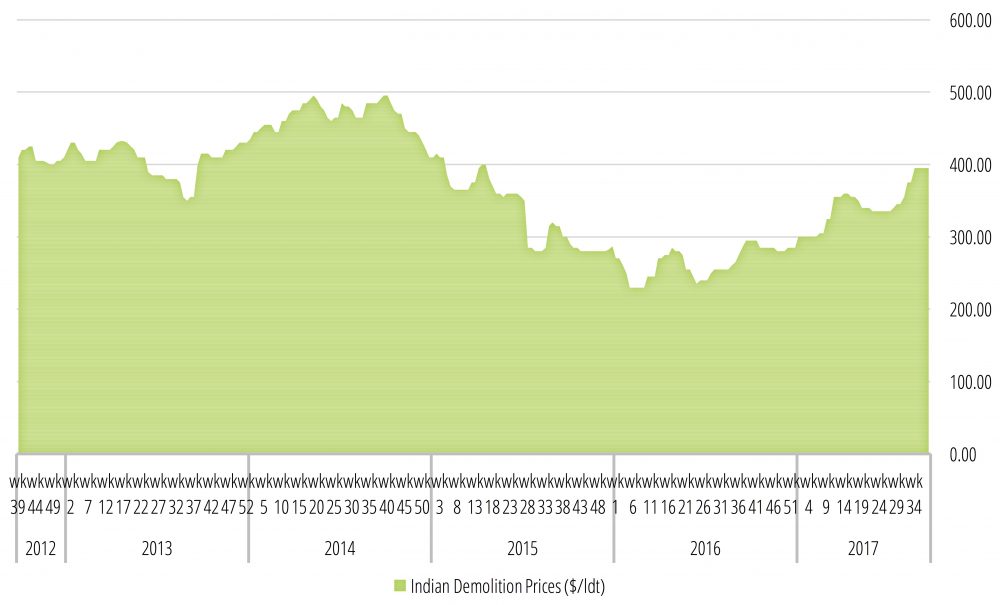
Figure 6: Reefer Fleet Development (Sept. 2017 v Jan. 2016)
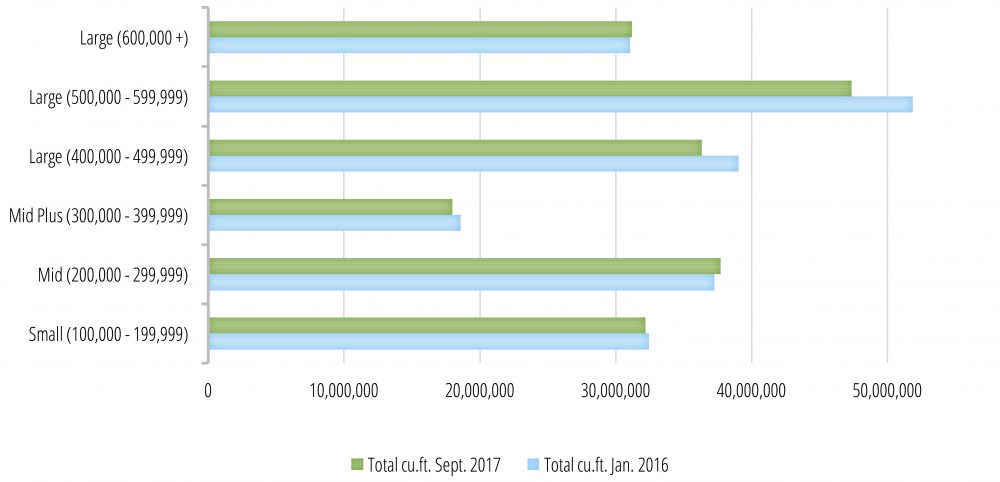
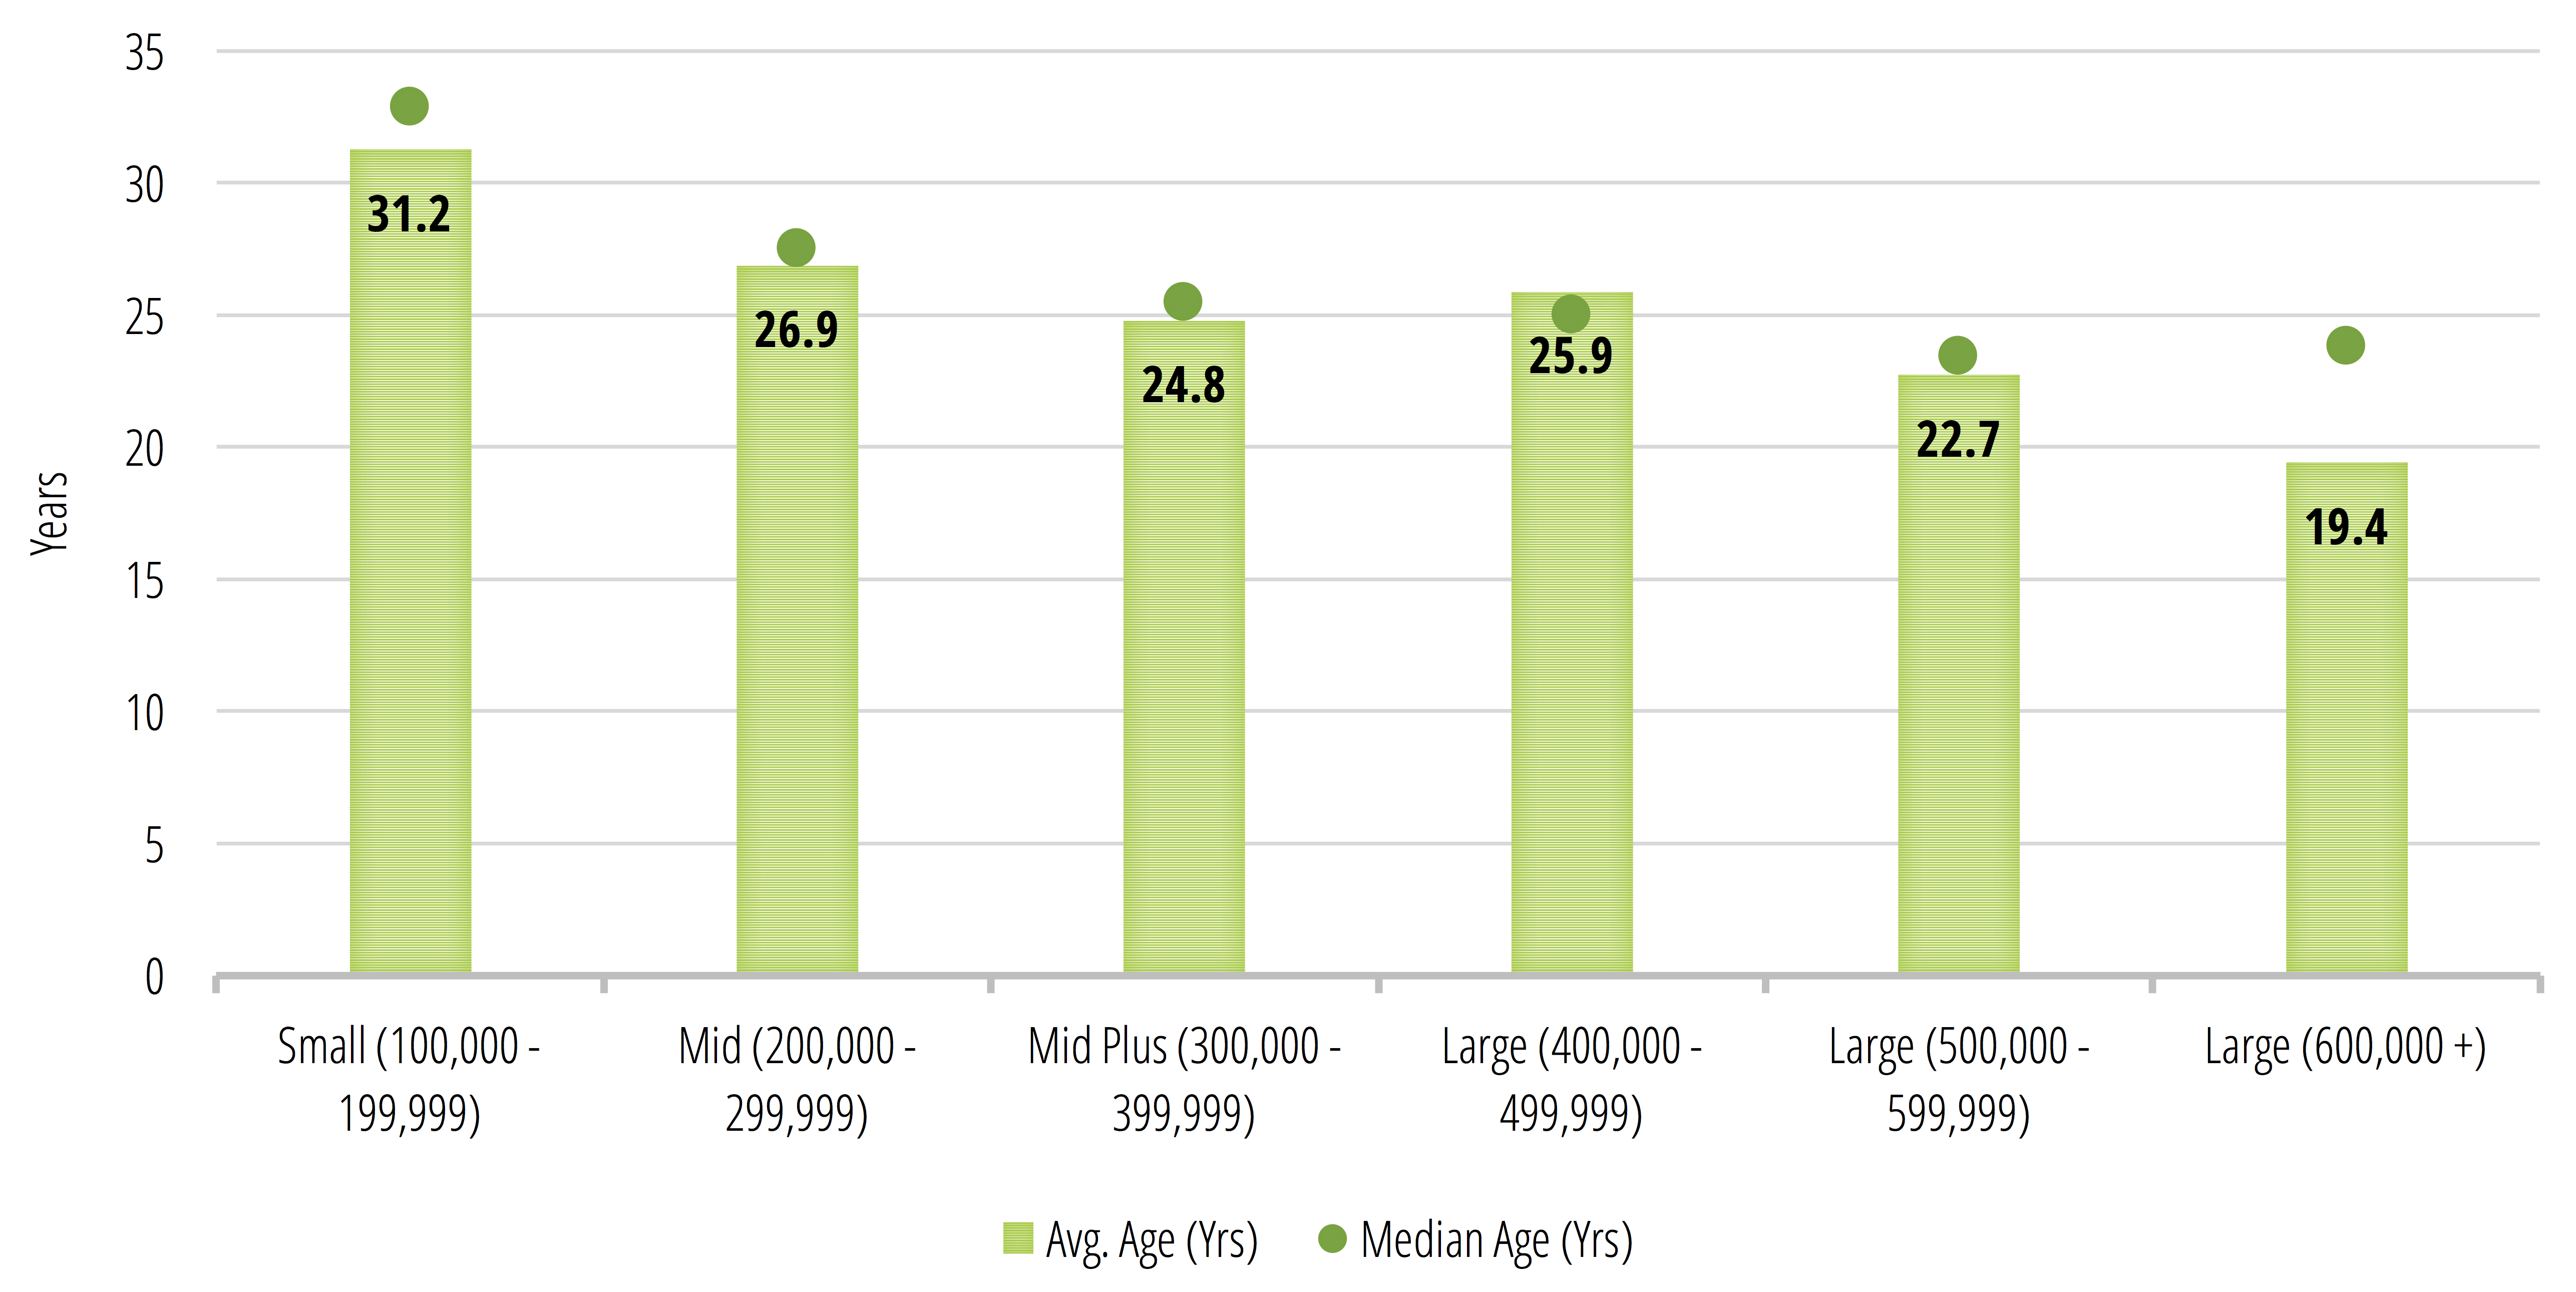
Figure 7: Average Vessel Age (Sept. 2017)
Reefer Newbuilding
2015 Delivery by Japanese Yard
290,000cbft design
4Ho/4Ha/12 Comp
8 x 5T derricks/3.t UP – &.7.5M
LOA 134m/B 20.20m/Dft 7.10m
2.20m deck – DWT 7200
Man B&W main engine
Price: On Request
265,000cnft design
4Ho/4Ha/12 Comp
8 x 5T derricks/3.t UP – &.7.5M
LOA 130m/B18.0m/Dft 7.50m
B&W main engine
Price: On Request
233,000cbft design
3Ho/3Ha/9 Comp
6 x5T derricks (3.5t UP)
LOA 120.75m/B 16.60m
Det 5900t at 7.50m or 5000t at 6.90m
Price: On Request
We can provide full specifications and designs for the above vessels. All prices are based on yards’ current design with NOX Tier II. Prices based on freezer only units will be slightly cheaper.
Delivery based on contracts in 2017 will be Q3 2019.
Contact brokers@irishshipbrokers.ie for all enquiries and further details.
*Disclaimer: All details are given in good faith and without guarantee.